Executive summary
- Extreme selection. About 32,000 startups apply each year for a single title. A regional final keeps a median of 10 finalists out of 160 applicants; in San Francisco, 10 of the 151 finalists reach the Top 10.
- The Top 10 stands out for its evidence, not its product. 60% of the Top 10 has strong commercial traction, against 14% of the other finalists; but having a product on the market makes no difference (60% against 58%).
- Capital already raised is a decisive signal. 60% of the Top 10 has reached Series A, against 4% of the others. The median amount raised is $9.6M against $1.2M.
- The bar for champions has risen. From 2017 to 2019, seed-stage startups won. Since 2022, every champion had already raised at least $20M.
- Deep technology dominates the winners' list. Since 2019, no champion has been pure software: materials, energy, medical devices.
- AI is not a selling point. 31% of the other finalists have AI at the core of their product; no Top 10 startup does.
- Time matters. The median age of the Top 10 is 6.5 years, against 3.5 years for the other finalists.
- The market must be global and easy to read. The median addressable market of the Top 10 is $13bn, against $5.4bn.
- Money is concentrated. The 151 finalists raised $278M in total, a third of it by five startups; the median of known amounts is $1.3M. Startups from small economies raise on average six times less than US startups.
- Two paths lead to the title. Funded technological breakthrough (the champions of 2022 to 2026) or proven use at scale (the software startups in the Top 10). A startup must know which path it is on, and produce the evidence that matches it.
A proposal for what comes next. The competition has grown faster than its format: about 200 regional champions for a single Top 10. The study proposes rewarding the best case in each of six groups of comparable startups, opening a platform that connects startups with investors before the final, and building a lasting network of former finalists from an atlas like this one (section 16). These ideas have limits and must be discussed with the organizer; their purpose is to start a momentum.
1Introduction
The Startup World Cup has become one of the largest startup competitions in the world, and its jury is made up entirely of venture capital investors. Organized since 2016 by Pegasus Tech Ventures, a Silicon Valley venture capital firm, it brings together regional finals on six continents. Their winners meet each fall in San Francisco for a Grand Finale whose prize is a $1M investment.
Why this study
Advice on how to "win a pitch competition" is plentiful, but it is rarely based on data. Yet the Startup World Cup offers a rare field of observation: 151 startups from 74 countries, all selected through a first regional win, judged on the same day by the same jury. By comparing those that reach the Top 10 with those that stop short, and by tracing the history of the champions, we can separate what really makes a difference from what does not.
The study's questions
- What is the real scale of the competition, from regional application to world title?
- Who are the 151 finalists of 2026: countries, sectors, age, maturity, funding, use of AI?
- What sets the Top 10 apart from the 141 other finalists?
- What is the profile of the champions since 2017, and how has it changed?
- Which strategies can a startup follow, depending on its profile, to maximize its chances, and how could the competition better connect startups and investors?
How to read this document
Sections 2 and 3 set out the method and the framework of the competition. Sections 4 to 9 present the results, with their figures. Sections 10 to 15 draw a practical method from them: levers, strategies by profile, pitch, 12-month plan, mistakes to avoid. Section 16 proposes changes to the competition; the study's limits are discussed in section 17. Each startup cited has a detailed profile in the atlas.
2Materials and methods
The study rests on three public datasets, collected and verified in November 2026: the 151 finalists of 2026, the champions since 2017 and 50 regional finals. Every figure is sourced in the atlas or in the sources of this document.
2.1 Study population
- The 151 finalists of the 2026 Grand Finale (San Francisco, 4 to 6 November 2026), based on the three official lists displayed on site: the Top 10, then the 141 other finalists. They come from 74 countries.
- The champions from 2017 to 2026, based on the competition's official page, victory press releases and the press. There was no Grand Finale in 2020 and 2021.
- 50 regional finals from 2023 to 2026, 20 of which publish a comparable number of applications.
2.2 Sources
Public sources only: startups' official websites, press releases, business and trade press, public pages of funding databases (Crunchbase, Tracxn, PitchBook, Dealroom), company registers, founders' public profiles, and pages of the Startup World Cup and Pegasus Tech Ventures. The atlas cites 611 sources for the 151 profiles. The research was carried out by AI agents working in batches, required to cite every source, then reviewed and corrected by hand.
2.3 Identification and cross-checking
Each name was searched on its own, then with "Startup World Cup 2026" and the name of the regional final, to rule out namesakes. Identification confidence is high for 93 startups and medium for 58. A second, independent pass reviewed 150 profiles; 112 were corrected or completed.
2.4 Variables measured
| Variable | Definition | Coverage |
|---|---|---|
| Country and continent | Country of operational headquarters | 151 startups |
| Sector | 15 harmonized sectors | 151 |
| Year founded | Legal incorporation, otherwise declared launch; as a last resort, the website's first archive, flagged as an estimate | 134 |
| Funds raised | Equity and grants in $M; debt, in-kind prizes and unclosed targets excluded | 76 disclosed amounts, 55 with no funding |
| Funding stage | Last known round: pre-seed, seed, Series A, Series B and later, self-funded | 102 determined |
| Product maturity | R&D, prototype, pilot, product on the market | 151 |
| Traction | None known, pilots or letters of intent, first customers, strong traction | 151 |
| Use of AI | AI at the core, AI integrated, no documented AI | 151 |
| LLM provider | Only on public evidence | 34 |
| Investor rating | Four criteria from 1 to 10 and an overall score | 151 |
| Addressable market (TAM) | 2025 global market of the targeted segment, in $bn of revenue | 151 |
| Scalability | Ease of replicating the model in other countries, from 1 to 10 | 151 |
2.5 Calculation rules
- Conversion to dollars at fixed rates: €1 = $1.08, £1 = $1.27, CHF 1 = $1.12, AUD 1 = $0.65, ¥100 = $0.67, ₩1,000 = $0.72, CNY 1 = $0.138. When sources diverge, the best-documented amount is used, with a range.
- Economic data: 2025 GDP, population and GDP per capita from the World Bank (IMF for Taiwan).
- Comparisons: the Top 10 is compared with the 141 other finalists. Amounts and ages, which are widely dispersed, are compared by their median; scores by their mean.
- Scale of the competition: the median number of applications to comparable regionals, multiplied by the number of regionals announced by the organizer, then cross-checked against the figure published by the organizer. National contests, student registrations and figures shared between two regionals are excluded.
2.6 Scoring grid
Each startup is scored as an investment bank analyst would, on four criteria from 1 to 10, each justified in one sentence in the atlas.
| Criterion | 1–3 | 4–6 | 7–8 | 9–10 |
|---|---|---|---|---|
| Disruption | Incremental improvement | Real innovation in a known category | New approach that can change practices | Platform or technology breakthrough |
| Business model strength | No proven revenue or customers | Pilots or first paying customers | Recurring revenue or solid contracts | Proven profitability at scale |
| Market potential | TAM below $1bn | TAM of $1bn to $20bn | TAM of $20bn to $100bn | TAM above $100bn, scalable and international |
| Risk (10 = very risky) | Risks under control | Usual risks | Significant risks | Major risks |
Risk combines technology, regulation, execution and team, cash relative to needs, competition and data uncertainty. The market score starts from the TAM (3 below $1bn, 4 from $1bn to $5bn, 5 from $5bn to $20bn, 6 from $20bn to $100bn, 7 above), with +1 if scalability reaches 8, −1 if it is 4 or less, and +1 if the startup sells in at least two countries.
Categories: A from 7, B from 6 to 6.9, C from 5 to 5.9, D below 5. These scores are an analyst's judgment on an explicit grid; they do not reproduce the jury's assessment.
2.7 Fairness adjustments to the addressable market
- When a startup covers several segments, they are added together.
- When the published figure measures a volume rather than revenue (invoices financed, sales, outstanding loans), it is converted into revenue.
- Very broad segments are flagged as upper bounds.
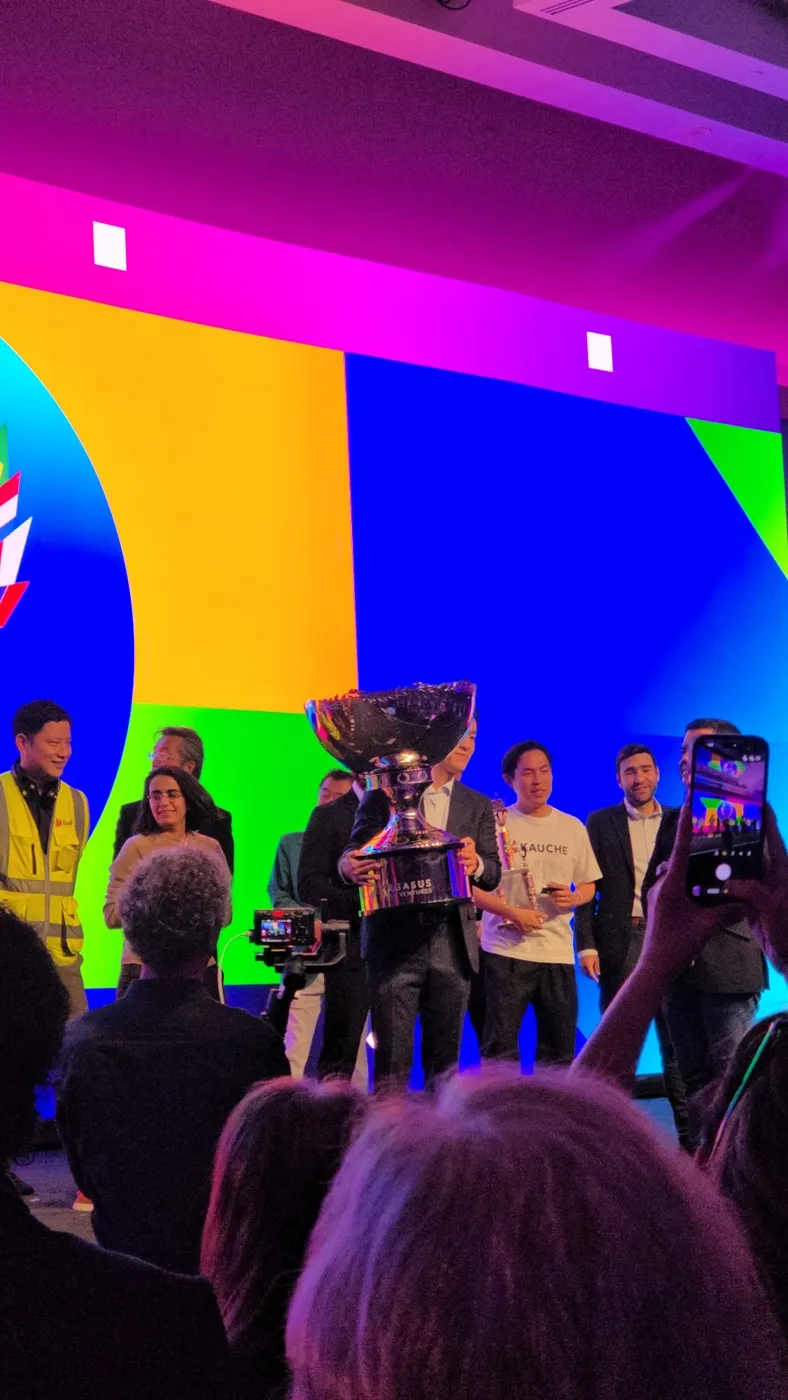
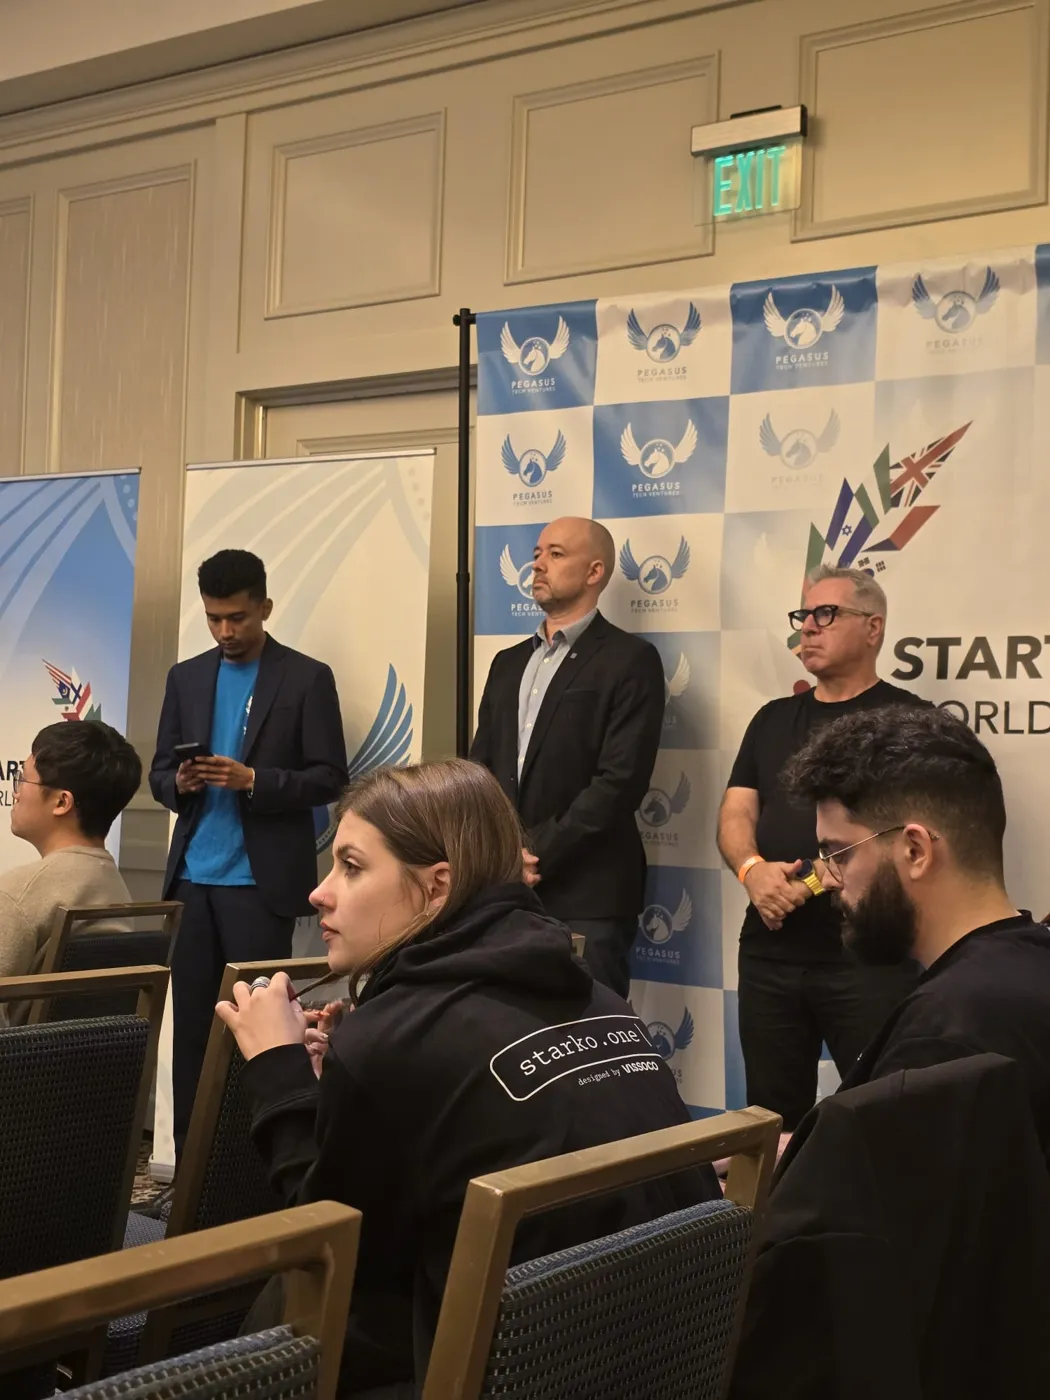
3The competition
The Startup World Cup is a global funnel: about 32,000 applications, 200 regional finals, 151 finalists in San Francisco, 10 startups in the Grand Finale and a single champion.
3.1 Organizer, format and prize
- Organizer. Pegasus Tech Ventures, a Silicon Valley venture capital firm chaired by Anis Uzzaman, launched the competition in June 2016 in 11 markets. The first Grand Finale took place on 24 March 2017.
- Regional finals. Each regional selects 10 to 20 finalists on paper, with a committee of investors, incubators and business angels, then names a winner on stage. Any sector and any stage are eligible, provided the company is incorporated.
- San Francisco week. Regional winners pitch in the semifinal. Ten are selected for the Grand Finale: a 4-minute pitch and 2 minutes of questions from the judges.
- Prize. A $1M investment from Pegasus Tech Ventures, as equity or a convertible note depending on the startup's stage, and global media exposure.
- Jury. Only partners of venture capital funds and corporate venture funds. In 2026: Connie Chan (a16z), Rajesh Swaminathan (Khosla Ventures), James Hardiman (DCVC), Scott Beechuk (Norwest), Jaya Gupta (Foundation Capital) and Jihong Kim (Samsung Ventures). The jury does not choose the best idea: it chooses the best investment.
3.2 Very rapid growth
| Edition | Published scale |
|---|---|
| 2016–2017 | 11 markets; 15 finalists at the first Grand Finale |
| 2018 | 28 finalists from 27 countries |
| 2020–2021 | No Grand Finale (pandemic); a few online regionals |
| 2022 | Regionals in more than 70 countries; 56 regional champions in the semifinal |
| 2023 | About 50 countries; 52 regional champions in the semifinal |
| 2024 | About 100 cities; 84 regional champions in the semifinal |
| 2025 | More than 100 regionals; more than 30,000 applicant companies from 135 countries |
| 2026 | About 200 regionals; 151 finalists on the official lists |
The number of regional champions almost quadrupled between 2023 and 2026, while the Top 10 stays fixed. Each edition is therefore more selective than the last.
3.3 The funnel
Official Grand Finale 2026 page and official finalist lists; applications estimated as about 200 regionals × 160 median applications.
The first cut is the hardest: a regional final keeps only one winner out of about 160 applicants, or 0.6%. The second takes place in San Francisco, where 7% of finalists reach the Top 10. Once in the Top 10, there is a one-in-ten chance left.
3.4 The scale of the regional finals
Across some twenty regionals from 2023 to 2026 that publish their figure, the median is 160 applications for 10 finalists. The largest exceed 200 (Tokyo, about 250 each year; Las Vegas during the CES trade show, about 500). The smallest are around 80 to 120 (Cyprus and Azerbaijan in 2025, New York and Nagoya in 2026).
2026 regional finals that publish their number of applications (press releases and local media).
The total estimate can be checked in two ways. By calculation: about 200 regionals × 160 applications = 32,000. By the organizer: the press release for the 2025 Grand Finale announced more than 30,000 applicant companies. Since the official pages sometimes announce 100 regionals and sometimes 200, the realistic range is 16,000 to 32,000 applications. The full table of the 50 documented regionals is in the atlas.
4Overview of the 151 finalists
The 2026 field is global, young and still not very mature: 74 countries, a median age of 4 years, and only 17% of startups with strong commercial traction.
4.1 Geography
| Continent | Startups | Share | Most represented countries |
|---|---|---|---|
| North America | 41 | 27% | United States (40) |
| Europe | 40 | 26% | Germany, Spain, Finland, France, Italy (3 to 4 each) |
| Asia | 32 | 21% | South Korea (4), Japan, Malaysia, Taiwan (3 each) |
| Latin America | 16 | 11% | Brazil, Costa Rica, Guatemala (2 each), then 10 countries with one startup |
| Africa | 10 | 7% | Ghana, Egypt, Morocco, Eswatini, Tunisia, Botswana, Kenya, Mauritius, South Africa, Angola |
| Oceania | 6 | 4% | Australia (4), New Zealand (2) |
| Middle East | 5 | 3% | United Arab Emirates, Israel, Saudi Arabia, Qatar, Jordan (1 each) |
The United States alone accounts for 26% of the field; no other country has more than 4 startups. The competition is therefore highly dispersed outside the United States: 73 countries share 111 places, almost always one or two per country. A startup does not just represent its region: it is often the only one from its country in San Francisco.
4.2 Sectors
Number of startups per sector, 151 finalists in 2026. In gold: the three health sectors, 35 startups in total.
AI and software lead in number, but health in the broad sense (medical devices, digital health, biotechnology) brings together 35 startups, almost as many as AI and software (41). Next come climate and energy, then agriculture and food. Deep technologies (materials, robotics, space) form a block of 21 startups.
4.3 Age
Founding year of the 134 finalists whose year is known; in gold, the 64 founded since 2023. Periods of unequal length.
The median age is 4 years in 2026. Nearly one startup in two was founded in 2023 or later, and 24 were founded in 2025 or 2026: the competition attracts many very young companies. At the other end, 8 startups are more than ten years old, including ZymoChem, the 2026 champion, founded in 2013.
4.4 Maturity
| Dimension | Breakdown of the 151 startups |
|---|---|
| Funding stage | Pre-seed 46 · Seed 34 · Series A 9 · Series B and later 3 · Self-funded 10 · Undetermined 49 |
| Product maturity | Product on the market 88 · Pilot 31 · Prototype 22 · R&D 10 |
| Traction | Strong traction 26 · First customers 51 · Pilots or letters of intent 31 · None known 43 |
Most finalists have a product on sale (58%) but traction that is still weak: 49% have pilots at best. Only 12 startups have reached Series A. The field is therefore made up mostly of seed-stage companies, which makes the rare cases that are already funded and growing all the more visible.
5Funding
The 151 finalists raised $278M in total, but the median startup raised only $1.3M and more than a third raised nothing. Money is concentrated, and it depends heavily on the size of the home economy.
5.1 What the finalists raised
- 76 startups have a disclosed amount (median $1.3M).
- 55 startups have raised no funds, 10 of which fund themselves from revenue.
- 18 startups have raised an undisclosed amount, and 2 show only a funding target.
The total of $278.2M includes $258.8M of equity and $19.4M of public grants.
5.2 Strong concentration
| Rank | Startup | Country | Funds raised |
|---|---|---|---|
| 1 | ZymoChem | United States | $25M |
| 2 | Yo-Kai Express | United States | $19M |
| 3 | Pleryon Therapeutics | China | $18.6M |
| 4 | ProcurePro | Australia | $15.4M |
| 5 | Astrome | India | $14M |
| 6 | Neurosoft Bioelectronics | Switzerland | $13.8M |
| 7 | BILIX | South Korea | $13.3M |
| 8 | ORA Technologies | Morocco | $11.4M |
| 9 | Enexor Energy and Chonex | United States | $10M each |
The five best-funded startups account for 33% of all the money raised by the field, and the first, ZymoChem, for 9% on its own. Any average calculated on this field is therefore misleading: it is the median that describes the typical startup.
5.3 By continent
| Continent | Startups | Funds raised | Average per startup |
|---|---|---|---|
| North America | 41 | $93.7M | $2.3M |
| Asia | 32 | $67.2M | $2.1M |
| Europe | 40 | $58.1M | $1.5M |
| Oceania | 6 | $19.0M | $3.2M |
| Africa | 10 | $15.5M | $1.6M |
| Middle East | 5 | $13.8M | $2.8M |
| Latin America | 16 | $10.9M | $0.7M |
A North American startup raises on average 1.6 times more than a European startup and more than three times more than a Latin American startup. Europe, though almost as well represented as North America, raises 1.6 times less in total. The highest averages are in Oceania ($3.2M) and the Middle East ($2.8M), but across few startups.
5.4 Raising from a small economy
| Size of the economy (2025 GDP) | Startups | Raised something | Raised at least $1M | Average amount raised |
|---|---|---|---|---|
| Less than $100bn | 21 | 33% | 14% | $0.4M |
| $100bn to $1,000bn | 50 | 48% | 32% | $1.3M |
| More than $1,000bn, excluding the United States | 39 | 49% | 36% | $2.8M |
| United States | 40 | 65% | 38% | $2.3M |
A startup from a country with a GDP below $100bn is about 2.5 times less likely to raise $1M than a startup from a mid-sized country, and raises on average six times less than a US startup, and seven times less than a startup from another large economy. Local capital is scarce, and foreign investors know these markets poorly.
Difficult does not mean impossible. Three startups from small economies have passed $1M: Astrolight (Lithuania, $4.75M with the NATO accelerator, European funds and the European Space Agency), FRESH 32 (Slovenia, $1.3M led by a Central European regional fund) and Nanogrow Biotech (Uruguay, $1.2M with an Argentine fund). What they have in common: the money does not come from their own country.
What a startup from a small economy can take from this:
- look for capital abroad from the first round, from regional or international funds;
- present the region, not the country, as the market; the home country serves as a test bed;
- draw first on non-dilutive funding (grants, public programs, prizes) to reach the funding round with more evidence;
- favor a model that generates revenue quickly, which reduces dependence on a funding round.
6Artificial intelligence and LLMs
Half of the finalists use AI, but AI does not set the best apart: no Top 10 startup has AI at the core of its product.
6.1 Three levels of use
| Level | Definition | Startups | Top 10 |
|---|---|---|---|
| AI at the core | The product does not exist without AI | 44 (29%) | 0 |
| AI integrated | AI is one function among others | 31 (21%) | 4 |
| No documented AI | No public trace of AI, which does not prove its absence | 76 (50%) | 6 |
Startups with AI at the core of their product are mostly software companies (28 of 44), followed by digital health startups (5). The Top 10, for its part, includes four startups that integrate AI as a tool (Kauche, ProcurePro, Yo-Kai Express, Crednce) and six with no documented AI.
6.2 Why AI is not enough
In 2026, access to large language models is within reach of any team: an AI feature can be copied in a few weeks. A jury of investors looks for what cannot be copied: customers, proprietary data, industrial know-how, regulatory approval. Top 10 startups talk about the problem solved and the result achieved; AI explains how, never why.
6.3 LLM providers
Only 34 startups give public information on the models they use, and 21 of these merely mention AI without naming a provider. Among the providers named:
| Provider | Startups that cite it |
|---|---|
| OpenAI (GPT, Whisper, Sora) | 8 |
| Anthropic (Claude) | 5, one of them based on a clue |
| Google (Gemini, Veo) | 3 |
| Microsoft Azure OpenAI | 2 |
| AWS Bedrock | 2 |
| Voice providers (ElevenLabs, Deepgram) | 4 |
| Proprietary models | 2 |
| DeepSeek, Mistral, Meta Llama | 1 each |
A trend is emerging: several startups report a multi-model architecture that chooses the provider by task or switches from one to another (Orbis, TIBOK, UnitSense). This approach reduces dependence on a single provider and a risk investors often point out: a startup built on a third party's API, which can change its prices or terms.
7An investor's reading
Scored on the grid in section 2.6, only 16 of the 151 startups earn an investment score of 6 or more, and the median score is 4.3 out of 10. Most finalists are still too young to be a solid investment.
7.1 Distribution of scores
| Category | Overall score | Startups | Share |
|---|---|---|---|
| A | 7 and above | 1 | 1% |
| B | 6 to 6.9 | 15 | 10% |
| C | 5 to 5.9 | 31 | 21% |
| D | below 5 | 104 | 69% |
The field's weakest criterion is business model strength (3.6 out of 10 on average), far behind disruption (5.0) and market (4.8). Average risk is high (6.9 out of 10). In other words: many interesting ideas, few proven business models.
7.2 The 16 cases rated A or B
| Startup | Country | Sector | Score | Disruption | Model | Market | Risk | Top 10 |
|---|---|---|---|---|---|---|---|---|
| LainTech | Spain | Climate & energy | 7.3 | 8 | 8 | 6 | 4 | yes |
| Belli | Singapore | Software | 6.8 | 5 | 8 | 7 | 4 | yes |
| ProcurePro | Australia | Software | 6.8 | 6 | 8 | 6 | 4 | yes |
| Renasys | Norway | Climate & energy | 6.5 | 6 | 7 | 6 | 4 | no |
| Yo-Kai Express | United States | Food | 6.5 | 7 | 7 | 6 | 5 | yes |
| EVR Motors | Israel | Mobility | 6.3 | 7 | 6 | 6 | 5 | no |
| Legit.Health | Spain | Digital health | 6.3 | 7 | 6 | 5 | 4 | no |
| Monet | Colombia | FinTech | 6.3 | 4 | 8 | 7 | 5 | yes |
| Pulster.ai | Guatemala | Software | 6.3 | 5 | 7 | 7 | 5 | no |
| Btrust | Chile | FinTech | 6.0 | 6 | 7 | 5 | 5 | no |
| Custplace | France | Software | 6.0 | 3 | 7 | 7 | 4 | no |
| Jetbeep | Ukraine | Industry & logistics | 6.0 | 5 | 7 | 6 | 5 | no |
| Kauche | Japan | Commerce | 6.0 | 4 | 7 | 7 | 5 | yes |
| NEOCRETE | New Zealand | Materials | 6.0 | 7 | 5 | 6 | 5 | no |
| PolyJoule | United States | Climate & energy | 6.0 | 7 | 5 | 7 | 6 | no |
| TIBOK | Mauritius | Digital health | 6.0 | 6 | 5 | 9 | 7 | no |
7.3 An analyst's grid is not the jury's choice
Only 6 of the 16 best-rated cases are in the Top 10. Conversely, four Top 10 startups get a C or D: ZymoChem (5.8), Enexor (4.8), BioSapien (4.5) and Crednce (3.5). Two reasons explain this.
- The jury values breakthrough more than immediate strength. ZymoChem, the 2026 champion, has the highest disruption score in the Top 10 (9 out of 10) but a low model score (4), for lack of a named commercial customer. A venture capital fund looks for exceptional returns, not only the safe case.
- The Top 10 reflects global representation. The 2026 Top 10 covers seven regions of the world, which suggests that geographic diversity counts in the selection. This is a reading of the results, not a published rule.
Several very strong cases remain outside the Top 10, such as Renasys, EVR Motors or Legit.Health. A case can therefore be excellent for an investor and still not be selected by the jury on the day: the pitch format, the diversity of the Top 10 and the judges' assessment also weigh in.
7.4 The addressable market
The field's median global addressable market is $5.4bn, and average scalability is 5.9 out of 10. The competition's official guide states that a market of at least $1bn is needed to interest a venture capital fund: most finalists clear this threshold, but few show that they can sell outside their own country.
8The 2026 Top 10
The Top 10 stands out neither for its product nor for its use of AI, but for its market evidence and the capital already raised.
8.1 The ten finalists
| Startup | Country | Business | Founded | Funding | Product and traction |
|---|---|---|---|---|---|
| ZymoChem (champion) | United States | Bio-based materials through fermentation | 2013 | Series A, $25M | Pilot; production of an ingredient at commercial scale |
| Belli | Singapore | Air cargo management software | 2024 | Seed, $2.8M | On the market; strong traction |
| BioSapien | United Arab Emirates | Implant for local delivery of cancer drugs | 2018 | Seed, $8.3M | Pilot |
| Crednce | Ghana | Secure milestone-based payments | 2025 | Pre-seed, no funding | Pilot |
| Enexor Energy | United States | Conversion of waste into electricity and heat | 2014 | Series A, $10M | Pilot |
| Kauche | Japan | Social commerce and group buying | 2020 | Series B and later, $9.3M | On the market; strong traction |
| LainTech | Spain | Hydrometallurgical metal extraction | 2019 | Self-funded | On the market; strong traction |
| Monet | Colombia | Online credit and salary advances | 2020 | Series A, $7M | On the market; strong traction |
| ProcurePro | Australia | Procurement software for construction | 2020 | Series B and later, $15.4M | On the market; strong traction |
| Yo-Kai Express | United States | Automated restaurants | 2016 | Series A, $19M | On the market; strong traction |
Two families emerge. Six usage startups (Belli, Kauche, LainTech, Monet, ProcurePro, Yo-Kai Express) already sell at scale. Four breakthrough startups (ZymoChem, BioSapien, Enexor, Crednce) are still at pilot stage; three of them make up for it with deep technology and significant funding. The champion comes from the second family.
8.2 Comparison with the other 141
Share of startups (%), Top 10 versus the other 141 finalists of the 2026 Grand Finale.
Having a product on the market and first customers is not enough: that is true of more than half the field. The difference lies in the next step: strong traction and a Series A. The same gaps appear in amounts and scores.
| Indicator | Top 10 | The other 141 |
|---|---|---|
| Funds raised (median of known amounts) | $9.6M | $1.2M |
| Median age | 6.5 years | 3.5 years |
| Median addressable market | $13bn | $5.4bn |
| Average overall score | 5.8 | 4.3 |
| Business model strength (average) | 6.0 | 3.5 |
| Disruption (average) | 6.1 | 4.9 |
| Risk (average, 10 = very risky) | 5.6 | 7.0 |
The widest gap is in business model strength: 2.5 points. That is the mark of a jury of investors.
8.3 The exceptions
- Belli (founded in 2024, $2.8M raised) makes up for its young age with strong traction: its software is already used by airlines on several continents.
- LainTech has raised no funds but has accumulated €22M in revenue: substantial revenue replaces the signal of a funding round.
- Crednce (Ghana, pre-seed) is the only finalist with neither funding nor strong traction. Its presence is explained more by the geographic diversity of the Top 10 than by its figures.
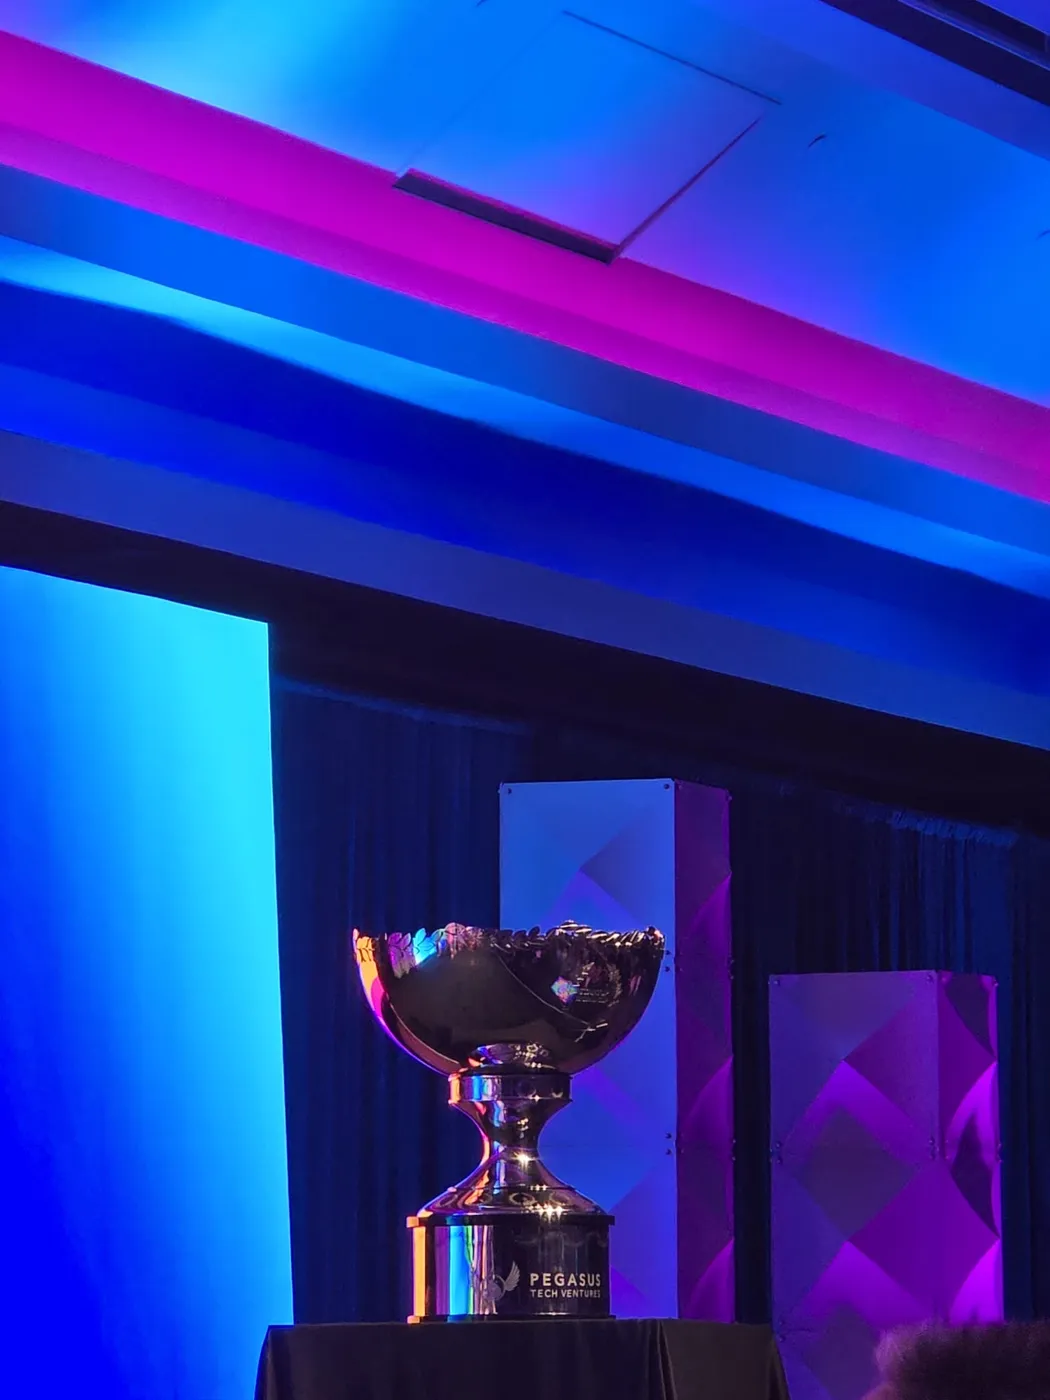
9The champions from 2017 to 2026
Since 2022, every champion has been a deep technology company that had already raised tens of millions of dollars and proven its product at scale. The $1M prize does not reward a promise: it adds to a case already validated by other investors.
9.1 The winners' list
| Year | Champion | Country | Business | Founded | Position at the time of victory | 2nd and 3rd |
|---|---|---|---|---|---|---|
| 2026 | ZymoChem | United States | Bio-based superabsorbent polymers | 2013 | $21M Series A; commercial-scale production of a key ingredient | Not published |
| 2025 | Coreshell | United States | Silicon anodes for batteries | 2017 | $24M raised in March 2025; 4 MWh pilot line | Intuition Robotics (Israel), BuuPass (Kenya) |
| 2024 | EarthGrid | United States | Plasma drilling robot for underground networks | 2016 (to be confirmed) | Seed round of about $30M; field trials | Alterno (Vietnam), ivWatch (United States) |
| 2023 | Aillis | Japan | AI flu diagnosis from throat images | 2017 | About $50M raised; device approved and reimbursed in Japan | VOINOSIS (South Korea), SaveFruit (Mexico) |
| 2022 | SRTX (Sheertex) | Canada | Ultra-durable textiles | 2017 | More than $100M raised; consumer brand with revenue | Not published |
| 2019 | Abivin | Vietnam | AI logistics optimization | 2015 | About $450K raised; large customers in Vietnam | Not found |
| 2018 | Leuko | United States | Non-invasive blood analysis | 2017 | Pre-seed, no revenue; spun out of MIT | Not found |
| 2017 | UniFa | Japan | Connected devices for daycare centers | 2013 | Products already sold to Japanese daycare centers | Not found |
There was no Grand Finale in 2020 and 2021. ZymoChem's 2026 victory was reported by participants present at the final; as of 8 November 2026, the official press release and the ranking of the 2nd and 3rd places had not been published.
9.2 The financial bar has changed scale
Funds raised before winning, in $M, orders of magnitude; n.d. = not disclosed. No Grand Finale in 2020 and 2021.
Between 2017 and 2019, a seed-stage startup could win: Leuko had no revenue, and Abivin had raised less than half a million dollars. Since 2022, every champion had raised at least $20M. The competition has grown, and the level of the cases with it.
9.3 Trends
- Deep technology dominates. Materials, energy, medical devices: since 2019, no champion has been pure software. The judges reward technologies that are hard to replicate.
- North America carries great weight. Five of the eight champions are American or Canadian, including three from the San Francisco Bay Area since 2024. Japan (two titles) and Vietnam (one title) are the only exceptions.
- Health remains a winning theme. Leuko and Aillis won with medical devices. Aillis won over the jury with regulatory approval and reimbursement already secured.
- The podium is opening up to the world. Recent runner-up places went to Israel, Kenya, Vietnam, South Korea and Mexico: the door is not closed to startups outside the United States, but it requires comparable evidence.
9.4 After the victory
The title mostly accelerates companies that are already up and running. UniFa raised about $10M in the wake of its victory, then more than ¥9bn in total. Leuko followed with a $1.8M seed round, a $5M Series A and a $4.5M grant from the US National Institutes of Health. Abivin raised more than $1.7M after its victory, with no Series A identified. Winning opens doors; it does not replace growth.
10What makes a champion: the seven levers
The findings of sections 7 to 9 point to seven levers. They are ranked by their weight in the data: the first four are built months before the competition; the last three are worked on in the application and on stage.
Lever 1: prove it with customers, not technology
Evidence. This is the clearest gap: business model strength scores 6.0 out of 10 in the Top 10, against 3.5 for the others; 60% of the Top 10 has strong traction, against 14%. LainTech, with no funding round but €22M in cumulative revenue, earns the highest score in the Top 10.
In practice. Named paying customers, recurring revenue, measured retention and a monthly growth curve to show. For a deep tech startup, the equivalent is an industrial contract, pilot production or a regulatory approval.
Lever 2: arrive with an investor signal
Evidence. 60% of the Top 10 has reached Series A, against 4% of the others; the median amount raised is $9.6M against $1.2M. Since 2022, every champion had raised at least $20M before winning.
In practice. The judges are investors: a round led by a well-known fund tells them the company has already passed due diligence. Failing that, substantial revenue plays the same role. Public grants and accelerator programs also count as external validation.
Lever 3: build up evidence over time
Evidence. The median age of the Top 10 is 6.5 years, against 3.5 years; seven of eight champions were at least four years old when they won; only Leuko won one year after its founding.
In practice. Age is not a criterion in itself: it measures the time spent turning a pilot into contracts. A young startup makes up for it with fast, visible traction (Belli, founded in 2024). Taking part early is still useful for the network, as long as the startup does not aim for the title too late in its preparation.
Lever 4: target a clear global market
Evidence. The median addressable market of the Top 10 is $13bn, against $5.4bn. The official guide sets a minimum of $1bn to interest a fund.
In practice. The jury must understand in one sentence why the company could be worth a billion: a quantified global market, calculated in two ways, and proof that it already sells outside its home country.
Lever 5: reduce perceived risk
Evidence. Risk scores 5.6 in the Top 10, against 7.0 for the others.
In practice. A complete team, regulation under control (certifications, approvals), at least 18 months of cash runway, industrial or distribution partners. Every foreseeable objection needs a quantified answer.
Lever 6: present AI as a means, never as the pitch
Evidence. No startup in the Top 10 has AI at the core of its product, against 31% of the others.
In practice. Talk about the problem solved and the measured result: time saved, cost avoided, revenue generated. Say in one sentence what AI makes possible, and what stops a competitor from doing the same thing with the same models.
Lever 7: be the best application from your region of the world
Evidence. The 2026 Top 10 spans seven regions: North America (3), Asia (2), Europe, the Middle East, Africa, Latin America and Oceania (1 each). Crednce (Ghana), at the pre-seed stage, is among them. This is a reading of the results, not a published rule.
In practice. For a startup outside the United States, the direct competition for a Top 10 spot is first with the other applications from its region. It is better to be clearly the best application from your continent than one of forty American applications.
Summary
| Lever | Indicator to track | Threshold observed in the Top 10 |
|---|---|---|
| 1. Proof through customers | Recurring revenue, paying customers, retention | Strong traction for 60% |
| 2. Investor signal | Amount raised, quality of investors | Median of $9.6M; Series A for 60% |
| 3. Evidence over time | Months of continuous growth | Median age of 6.5 years |
| 4. Global market | Quantified TAM, countries where the startup sells | Median TAM of $13bn |
| 5. Reduced risk | Team, regulation, cash runway | Risk scored 5.6 out of 10 |
| 6. AI as a means | Measured result for the customer | 0% with AI at the core |
| 7. Best in its region | Rank among applications from its continent | Seven regions in the Top 10 |
11Does usage create value?
Yes for software, no for breakthrough technology: two paths lead to the title, and each requires different evidence.
Champions (year) and 2026 Top 10 finalists, placed by zone, not by exact position.
11.1 The funded breakthrough path
Recent champions won without large-scale commercial usage. ZymoChem had no named commercial customer; EarthGrid was at the field-trial stage; Leuko had no revenue. Their value came from elsewhere:
- technical proof that is hard to copy (process, material, device, patents);
- a very large addressable market;
- $20M to $100M already invested by funds, which validate the technology in place of customers.
In that case the jury buys a breakthrough, not usage. This path is capital-intensive: without substantial funding, breakthrough technology remains a lab project in an investor's eyes.
11.2 The proven usage path
For software, a platform or a service, usage is the only evidence that counts. Copying software is cheap; what cannot be copied is thousands of returning users, accumulated data and renewed contracts. The six usage-driven startups in the 2026 Top 10 all have strong traction, and most have already raised a Series A on the strength of it.
Usage creates value only if it meets three conditions:
- it is paid for: customers who pay, not free users;
- it comes back: retention measured over several months;
- it grows: continuous monthly growth, visible on a curve.
11.3 The summit: breakthrough and usage
The strongest applications combine both: Aillis had both an approved AI medical device and reimbursement; SRTX, a new material and a consumer brand; LainTech, a novel industrial process and €22M in revenue. This is the profile the jury favors most readily.
11.4 Which indicators to track
| Path | Indicators to show the jury |
|---|---|
| Funded breakthrough | Amount raised and quality of the funds; patents; trial results; pilot production; letters of intent from industrial companies; regulatory approvals |
| Proven usage | Monthly recurring revenue and its growth; number of paying customers; 90-day retention; customer acquisition cost and customer lifetime value; share of revenue from outside the home country |
| Breakthrough and usage | Both columns, with a measured result at customers (cost avoided, time saved, emissions reduced) |
12Strategies by startup profile
There is no single strategy: a software startup, a materials startup and a health startup do not bring the same evidence. This section applies the levers to six profiles common in the field.
12.1 B2B software and platforms
- What the jury expects: growing recurring revenue, named customers, high retention and sales in several countries.
- The trap: presenting features and AI instead of customer results. Software can be copied; a customer base cannot.
- Examples from the field: ProcurePro (procurement software for construction, Series B, international traction) and Belli (air freight, customers on several continents less than three years after its founding).
- Priority: show a monthly revenue curve over 12 to 24 months and at least one reference customer outside the home country.
12.2 Deep tech, materials and energy
- What the jury expects: solid technical proof, protected intellectual property, a credible industrial path and funding already secured.
- The trap: presenting a lab result with no industrial partner and no scale-up plan.
- Examples: the last five champions fit this profile; LainTech shows that an industrial process can also generate substantial revenue.
- Priority: a pilot with an industrial company, quantified letters of intent, public research grants and a first round led by a specialist fund.
12.3 Health and regulated sectors
- What the jury expects: a regulatory approval obtained or a credible timeline, clinical evidence and an identified payer (insurer, hospital, health system).
- The trap: underestimating regulatory timelines or not knowing who pays.
- Examples: Aillis (2023 champion) had an approved and reimbursed device in Japan; Legit.Health is a certified medical device adopted by health systems.
- Priority: publish clinical or usage results, name the payer, show the cost avoided or the medical time saved.
12.4 Startups from small or emerging economies
- What the jury expects: the same evidence as everyone else, with a market presented at the scale of a region or a continent.
- The trap: presenting the national market as the market. An investor funds a market, not a country of one million people.
- Examples: Astrolight (Lithuania), FRESH 32 (Slovenia) and Nanogrow Biotech (Uruguay) raised more than $1M from foreign investors; Monet (Colombia) went through Y Combinator.
- Priority: raise from abroad from the first round, open a second country, use local non-dilutive funding and be clearly the best application from your region.
12.5 Very young startups (under two years old)
- What the jury expects: exceptional traction speed, an already experienced team and an obvious market.
- The trap: aiming for the title too early, with unpaid pilots.
- Examples: Belli (founded in 2024) is in the Top 10 thanks to its traction; Crednce (2025) most likely thanks to geographic diversity.
- Priority: use the competition for networking and investor meetings, and come back the following year with numbers.
12.6 Already funded startups (Series A and later)
- What the jury expects: growth that justifies the capital raised, global ambition and a clear use for the million dollars.
- The trap: an established-company pitch, with no tension and no new ambition.
- Examples: SRTX (more than $100M raised) and Aillis (about $50M) won with a vision of international expansion.
- Priority: present the next milestone (new market, new approval, new plant) and what the win would accelerate.
13The application and the pitch
The pitch does not create the evidence; it must make it visible in 240 seconds. The organizer publishes an official guide with a timing for each slide, and the judges score five criteria: business model, market opportunity, differentiation, growth potential and ability to execute.
13.1 The application
- Regional selection is based on the application, reviewed by a committee of investors, incubators and business angels. The application must therefore convince without the founder there to defend it.
- According to the official FAQ, the optional application video does not necessarily improve the odds: it is better to work on the numbers than on the staging.
- Every quantified claim must be verifiable: an investor committee reads an application as a first pre-investment analysis.
13.2 The official timing
| Slide | Duration | What the jury must remember |
|---|---|---|
| Opening | 10 s | What you do better than anyone, in one sentence. |
| Problem | 30 s | The problem, with a figure or a real case. |
| Solution | 45 s | The product, shown in an image or a demo. |
| Traction | 30 s | Paying customers, revenue, retention, growth. This is the slide that decides. |
| Business model | 30 s | Who pays, how much, at what margins. |
| Market | 15 s | At least $1bn of opportunity, calculated top-down and bottom-up. |
| Financials | 15 s | Projections over 3 to 5 years, backed by data. |
| Team | 30 s | Why this team: experience, results, patents. |
| Competition | 15 s | Existing alternatives and your advantage; according to the guide, claiming "no competitors" is a red flag. |
| Funding | 10 s | Amount raised, needs, use of funds. |
| Conclusion | 10 s | The key message. |
Source: official pitch guide. In the semifinal, with more than 200 startups, speaking time can be cut to one minute: you need a short version that keeps the opening, the traction and the market.
13.3 The two minutes of questions
In two minutes, the judges only have time for a few questions. The topics below follow from the official criteria and the pitch guide; a 15-second answer should be ready for each.
- Who are your competitors, and why will you win?
- How much does it cost to acquire a customer, and how much does a customer bring in over its lifetime?
- What is your retention or renewal rate?
- What is your current revenue and its monthly growth?
- What is the regulatory risk, and where do your approvals stand?
- Why your team, and who is missing?
- How will you expand outside your country?
- How much are you raising, at what valuation, and for what?
- What stops a large corporation from doing the same thing?
- What will you do with the million-dollar prize?
13.4 On stage
- Answer with a number first, then the explanation.
- Never argue with a judge: acknowledge the risk, then give the measure that reduces it.
- Show rather than describe: a screenshot, a curve, a photo of the product in use.
- Rehearse in real conditions: timer, microphone, stage, and someone asking hard questions. Around thirty rehearsals is a reasonable order of magnitude.
- Prepare a simple English version: short sentences, numbers spoken clearly, no local jargon.
14The 12-month plan
A startup needs about a year to gather a finalist's evidence. The order matters: without proven usage, fundraising is hard; without funding, expansion is slow; without expansion, the pitch has nothing global to show.
Template plan; each gate must be passed before the next phase.
For a deep tech startup, phase 1 becomes "prove the technology": independent trials, industrial pilot, patents. For a startup from a small economy, phase 2 is the hardest: it has to raise from foreign investors. The Startup World Cup itself helps here: each regional final and the San Francisco week are opportunities to meet funds that invest outside their own country.
Checklist before the regional final
- Monthly recurring revenue tracked and reported for at least 6 months
- Three named reference customers, ready to vouch for you
- Retention or renewal rate measured
- Global market calculated top-down and bottom-up, with sources
- Competitor map and a defensible advantage in one sentence
- Funding round closed or under way with a named investor
- Customers or partners in at least two countries
- Approvals or certifications obtained, or a credible timeline
- Complete team in key roles
- 4-minute pitch and one-minute version, rehearsed in real conditions
- 15-second answers to the ten questions in section 13.3
- Specific use for the million-dollar prize
15Mistakes to avoid
The costliest mistakes are not made on stage but while preparing the application.
| Mistake | Why it is costly | What to do instead |
|---|---|---|
| Pitching the technology instead of the results | The jury evaluates an investment, not a feat | Open with the problem, prove it with customers |
| Putting AI forward as the main argument | No startup in the 2026 Top 10 does this; an AI feature can be copied | Show the measured result and what cannot be copied |
| Counting free pilots as traction | 48% of the field is at this stage; it is not a distinctive signal | Convert pilots into paying contracts |
| Claiming "no competitors" | The official guide calls it a red flag | Present the alternatives and the defensible advantage |
| Presenting a national market | A fund invests in a global market of at least $1bn | Quantify the global market and show sales outside the country |
| Giving unverifiable figures | The committee reads the application as a pre-investment analysis | Cite audited or sourced figures |
| Aiming for the title too early | Recent champions were 4 to 13 years old | Take part for the network, come back with evidence |
| Ignoring the funding question | The prize is an investment, not a grant | State how much you are raising and what the million would accelerate |
| Having only a long version of the pitch | Speaking time can be cut in the semifinal | Prepare a one-minute version |
| Arguing with a judge | The jury also watches the ability to execute and to listen | Acknowledge the risk, give the measure that reduces it |
16Proposals: from competition to network
The Startup World Cup has grown faster than its format: the number of regional champions has nearly quadrupled in three years, yet there is still only one Top 10 and a single title. This section proposes three changes to turn a one-week competition into a lasting network between startups and investors. They are ideas for discussion drawn from the study, not recommendations from the organizer; their purpose is to start a movement.
16.1 The situation
- An increasingly narrow selection. 52 regional champions in the semifinal in 2023, 84 in 2024, about 200 regional finals in 2026: the share of finalists who reach the main stage has fallen sharply.
- 141 finalists leave without comparable visibility. Yet section 7.3 shows that several of the highest-scoring applications, such as Renasys, EVR Motors and Legit.Health, stayed outside the Top 10.
- Few connections, and little structure. The atlas identifies only 18 investors present in at least two startups, and none of the Grand Finale judges' funds among the known investors of the 151 finalists. Of about 400 listed mentors and judges, only about twenty have documented links with the finalists.
- Post-final follow-up still to be built. Meetings during the San Francisco week happen by chance in the corridors, and no shared tool exists to follow up on them.
16.2 Awards by group
The idea is to keep the single global title while also rewarding the best application in each group of comparable startups. A materials startup and a software startup are not judged on the same evidence (section 12); coherent groups make specialist juries and fairer comparison possible.
| Proposed group | Sectors included | 2026 finalists | Suggested jury |
|---|---|---|---|
| Health and life sciences | Medical devices, digital health, biotechnology | 36 | Health and biotech funds |
| AI and software | Applied AI, enterprise software | 40 | Software and SaaS funds |
| Climate, energy and materials | Energy, climate, advanced materials | 21 | Climate and deep tech funds |
| Hardware and industry | Robotics, space, mobility, industry and logistics | 19 | Industrial and corporate funds |
| Digital services | FinTech, education, commerce, cybersecurity | 22 | FinTech and consumer funds |
| Agriculture and food | AgriTech, food | 13 | Agrifood funds |
The six groups cover all 151 finalists of 2026. Two cross-cutting awards could be added: the best application from each continent, which would make explicit the global representation observed in the Top 10, and the best seed-stage application, which would encourage young startups without putting them in direct competition with companies funded to the tune of tens of millions.
The winner of each group could receive stage visibility and priority meetings with the group's funds. The organizer already states that a fund linked to the competition may invest in one to five finalists per edition in addition to the champion: awards by group would give these choices a clear framework.
16.3 An interactive platform before the final
Proposal from the study; the three stages rest on one shared data foundation.
The idea is to open, two to three months before the Grand Finale, a platform where each regional champion publishes a standardized profile, modeled on the atlas entries:
- business, country, year founded, team;
- funding stage, amounts raised, investors;
- product maturity and traction, with indicators that are self-reported, then verified;
- addressable market and countries where the startup sells;
- needs: amount sought, industrial or distribution partners sought.
Registered investors filter profiles according to their thesis (sector, stage, region, ticket size) and request meetings, scheduled during the San Francisco week. Startups thus arrive with an agenda of targeted meetings rather than hoping for a chance encounter in the corridor. The judges also get a complete view of the applications before the semifinals.
16.4 A network after the final
The final should not be an end point. With about 200 regional champions a year, the competition could build, within five years, a network of nearly 1,000 qualified startups across six continents, making it one of the largest pools of selected startups in the world.
- An alumni directory by cohort, built from the platform profiles and open to startups, investors and mentors.
- Indicators updated every quarter by participating startups (revenue, funding rounds, hires, countries), to track their trajectory.
- Ongoing matchmaking with mentors and judges by sector and region.
- Communities by group and by region, extending the regional finals throughout the year.
- A public annual report on the cohort: funding rounds within 12 months, partnerships, survival, along the lines of this study.
16.5 Measuring success
| Indicator | What it measures |
|---|---|
| Meetings scheduled per startup before the final | The quality of matchmaking |
| Share of finalists that raised funds within 12 months | The effect on funding |
| Amount raised from investors met through the platform | The direct effect of the platform |
| Industrial or commercial partnerships signed | The effect beyond funding |
| Share of alumni active in the network after one year | The vitality of the network |
16.6 A phased rollout
- Pilot with the 2026 cohort: invite the 151 finalists to complete and validate their atlas entry, then share it with the investors attending the final.
- Platform before the 2027 final: standardized profiles and meeting booking for the 2027 regional champions.
- Awards by group at the 2027 final: six groups, specialist juries, global title unchanged.
- Alumni network from 2028: directory, quarterly indicators and first annual report.
16.7 Caveats
These proposals inherit the limitations of the study (section 17) and add others.
- They are not the organizer's proposals. Their feasibility, cost and value for Pegasus Tech Ventures and its partners remain to be assessed with them.
- The groups are a first proposal, built on the 2026 sector breakdown; they will need adjusting every year.
- The data foundation requires the startups' consent. The atlas uses public sources; a matchmaking platform requires data provided and validated by the startups themselves, in compliance with data protection and confidentiality rules.
- Self-reported data must be verified so that investors can rely on it.
- More awards must not dilute the title. The prestige of the world champion must remain intact.
The aim is not to impose a model, but to open the discussion with the organizer, investors and past finalists.
17Limitations of the study
The conclusions describe what has won; they do not guarantee what will win.
- Small samples. The Top 10 has 10 startups and the list of winners 8 champions: a single case can shift an average. Very clear gaps (Series A, amounts raised, traction) are more robust than small ones.
- Correlation and causation. Top 10 startups have more traction, but the study does not prove that traction causes selection: other unmeasured factors (pitch quality, team, context) also play a role.
- Public, self-reported data. Amounts, traction and founding years come from public sources, often supplied by the startups themselves. 18 amounts are not disclosed, 17 founding years are unknown and 27 are estimated.
- Analyst scores. The disruption, model, market and risk scores are a judgment on an explicit grid, not the jury's evaluation. Section 7.3 shows that the two diverge.
- Addressable markets. Market research reports use different definitions; their figures are orders of magnitude.
- Jury deliberations. The jury publishes neither its scores nor its discussions. The pursuit of geographic diversity is a hypothesis drawn from the results.
- Scale of the competition. The estimate of 32,000 applications rests on 20 regional finals that publish their figure and on a number of regional finals that varies across official pages.
- The 2026 edition. ZymoChem's win was reported by participants; the official press release had not been published as of 8 November 2026.
- Data cutoff. All data is as of November 2026. The proposals in section 16 are ideas for discussion drawn from this data, without validation by the organizer.
18Conclusion
The Startup World Cup is an investors' competition, and it is won the way you convince an investor: with evidence. Out of about 32,000 applicants, those who reach the Top 10 are not the ones with the best idea or the most fashionable technology, but the ones who can show that customers pay, that funds have already invested and that the market is global.
Two paths lead to the title. The first, taken by the recent champions, is funded technological breakthrough: technology that is hard to copy, validated by tens of millions of dollars. The second is proven usage at scale, the path of the software and service companies in the Top 10. The summit combines both.
For a founder, the lesson is practical: choose your path, spend twelve months building the evidence that matches it, and only then prepare the pitch. For a startup from a small economy, there is an additional lesson: seek capital and customers beyond your borders, and aim to be the best application from your region of the world. The San Francisco stage only reveals work done beforehand.
Finally, the competition itself can go further. Every year it brings together hundreds of selected startups and leading investors, but most of these encounters end with the final. Awards by group, a matchmaking platform before the event and an alumni network would give this pool lasting value. This study, with its limitations, and the atlas that accompanies it are a first step: their ambition is to open the discussion and start a movement.
The week in pictures
Two films shot during the Grand Finale week in San Francisco, 4 to 6 November 2026.

Films and photos: TIBOK, 2026 finalist.
Appendix A. Regional finals that publish their number of applications
| Year | Regional final | Applications | Finalists | Use in the study |
|---|---|---|---|---|
| 2026 | United States, Las Vegas (CES) | 500 | 15 | Median |
| 2026 | Vietnam | 500 | 10 | Excluded: national competition |
| 2026 | Japan, Tokyo | 250 | 10 | Median |
| 2026 | Japan, Kyushu | 250 | 10 | Excluded: figure shared with Tokyo |
| 2026 | Venezuela | 200 | 10 | Median |
| 2026 | Eswatini | 161 | 10 | Median |
| 2026 | Azerbaijan | 160 | 10 | Median |
| 2026 | Tunisia | 160 | not published | Median |
| 2026 | Kazakhstan | 140 | 10 | Median |
| 2026 | Japan, Nagoya | 120 | 10 | Median |
| 2026 | United States, New York | 116 | 12 | Median |
| 2026 | India, Greater Noida | 100 | 25 | Median |
| 2026 | India, Pune | 50 | not published | Excluded: registrations, not applications |
| 2025 | Bangladesh | 4,500 | 15 | Excluded: student registrations |
| 2025 | Japan, Tohoku | 220 | 10 | Median |
| 2025 | Malaysia | 200 | not published | Median |
| 2025 | Kenya | 160 | 10 | Median |
| 2025 | Portugal | 120 | 15 | Median |
| 2025 | Cyprus | 83 | 9 | Median |
| 2025 | Azerbaijan | 80 | 8 | Median |
| 2024 | Japan, Tokyo | 240 | 11 | Median |
| 2024 | Japan, Kyoto | 126 | 12 | Median |
| 2023 | Japan, Tokyo | 300 | 10 | Median |
| 2023 | Japan, Kyoto | 135 | 12 | Median |
The sources for each row and the 26 other documented regional finals (known finalists, applications not published) are in the atlas, in the "Scale of the regional finals" section.
Appendix B. Glossary
| Term | Definition |
|---|---|
| Pre-seed, seed | First funding rounds, often from angels and specialist funds, before the business model is proven |
| Series A, Series B | Funding rounds led by venture capital funds once the model is proven, to accelerate growth |
| Traction | Evidence of market adoption: paying customers, revenue, growth, retention |
| TAM | Total addressable market: the annual global revenue of the target segment if the startup captured all of it |
| Scalability | Ability to grow and expand to other countries without a proportional rise in costs |
| Retention | Share of customers who keep using or paying for the service after a given period |
| Deep tech | Innovation stemming from scientific research or advanced engineering: materials, energy, biotechnology, devices |
| LLM | Large language model, used by generative AI applications |
| Convertible note | A loan that converts into equity at a later funding round |
| Non-dilutive funding | Grants, prizes and public programs that do not take a stake in the company |
Sources
Study data
- Atlas of the 151 Grand Finale 2026 startups: 151 profiles and 611 sources, "Materials and methods" section
Organizer
- Startup World Cup: Grand Finale 2026
- Startup World Cup: past champions
- Startup World Cup: FAQ
- Official pitch guide
- Announcement of the 2026 judges
- Grand Finale 2025 press release (30,000 applications)
Winner press releases
Economic data
- World Bank, indicators NY.GDP.MKTP.CD, SP.POP.TOTL and NY.GDP.PCAP.CD (2025); IMF for Taiwan.